Electric Power ›› 2023, Vol. 56 ›› Issue (10): 11-21.DOI: 10.11930/j.issn.1004-9649.202208038
• Key Technology of Hydrogen Energy and Its System Integration Control for the New Power System • Previous Articles Next Articles
Tiejiang YUAN1(), Yijin ZHANG1(
), Zijuan YANG1,2(
), Dongfang JIANG3(
)
Received:
2022-08-10
Accepted:
2022-11-08
Online:
2023-10-23
Published:
2023-10-28
Supported by:
Tiejiang YUAN, Yijin ZHANG, Zijuan YANG, Dongfang JIANG. Medium and Long-Term Hydrogen Load Prediction Based on System Dynamics[J]. Electric Power, 2023, 56(10): 11-21.
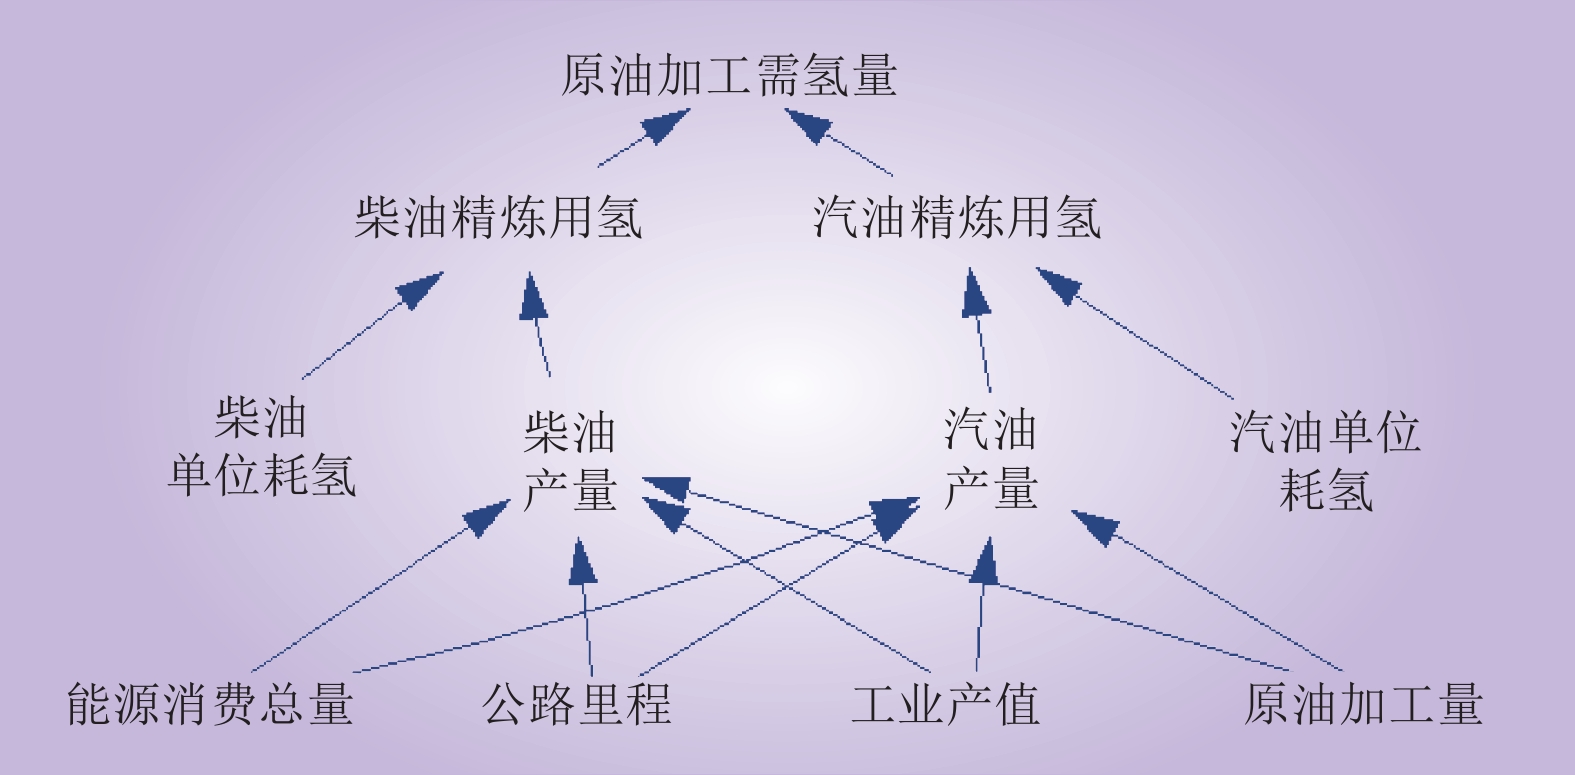
汽油产量 影响因素 | 关联度 系数 | 柴油产量 影响因素 | 关联度 系数 | |||
公路里程 | 0.9364 | 原油加工量 | 0.9020 | |||
能源消费总量 | 0.9363 | 工业产值 | 0.8419 | |||
工业产值 | 0.9044 | 能源消费总量 | 0.8162 | |||
原油加工量 | 0.8656 | 公路里程 | 0.8142 | |||
地区生产总值 | 0.8344 | 地区生产总值 | 0.7258 | |||
交通业产值 | 0.8260 | 货运量 | 0.7242 | |||
人均可支配收入 | 0.7571 | 交通业产值 | 0.7169 | |||
私人汽车保有量 | 0.6261 | 民用客货车数量 | 0.6337 | |||
邮政业务总量 | 0.5852 | 邮政业务总量 | 0.5528 |
Table 1 Correlation of influencing factors
汽油产量 影响因素 | 关联度 系数 | 柴油产量 影响因素 | 关联度 系数 | |||
公路里程 | 0.9364 | 原油加工量 | 0.9020 | |||
能源消费总量 | 0.9363 | 工业产值 | 0.8419 | |||
工业产值 | 0.9044 | 能源消费总量 | 0.8162 | |||
原油加工量 | 0.8656 | 公路里程 | 0.8142 | |||
地区生产总值 | 0.8344 | 地区生产总值 | 0.7258 | |||
交通业产值 | 0.8260 | 货运量 | 0.7242 | |||
人均可支配收入 | 0.7571 | 交通业产值 | 0.7169 | |||
私人汽车保有量 | 0.6261 | 民用客货车数量 | 0.6337 | |||
邮政业务总量 | 0.5852 | 邮政业务总量 | 0.5528 |
掺氢比/% | CH4占比/% | H2占比/% | 高热值/(MJ·m–3) | 密度 /(kg·m–3) | ||||
0 | 96.114 | 0.0350 | 35.785 | 0.706 | ||||
5 | 91.308 | 5.0333 | 34.082 | 0.674 | ||||
10 | 86.507 | 10.032 | 32.378 | 0.643 | ||||
15 | 81.699 | 15.028 | 30.676 | 0.612 | ||||
20 | 76.891 | 20.028 | 28.975 | 0.581 |
Table 2 Parameter values for different hydrogen blending ratio
掺氢比/% | CH4占比/% | H2占比/% | 高热值/(MJ·m–3) | 密度 /(kg·m–3) | ||||
0 | 96.114 | 0.0350 | 35.785 | 0.706 | ||||
5 | 91.308 | 5.0333 | 34.082 | 0.674 | ||||
10 | 86.507 | 10.032 | 32.378 | 0.643 | ||||
15 | 81.699 | 15.028 | 30.676 | 0.612 | ||||
20 | 76.891 | 20.028 | 28.975 | 0.581 |
第t–1年γ3 | 第t年掺氢比/% | |
0≤γ3<0.0035 | 5 | |
0.0035≤γ3<0.007 | 10 | |
0.007≤γ3<0.0105 | 15 | |
γ3≥0.0105 | 20 |
Table 3 Relationship between hydrogen blending ratio and γ3
第t–1年γ3 | 第t年掺氢比/% | |
0≤γ3<0.0035 | 5 | |
0.0035≤γ3<0.007 | 10 | |
0.007≤γ3<0.0105 | 15 | |
γ3≥0.0105 | 20 |
方程序号 | 参数估计值 | |
(10) | A1 = 0.045;A2 = −1061.35;A3 = 1229 | |
(12) | A4 = 1.319;A5 = −5.176;A6 = 3152.22 | |
(14) | C1 = 0.1587;C2 = 0.0.3547;C3 = −14.7019; C4 = −0.0999;C5 = 680.6551 | |
(15) | C6 = −0.0873;C7 = 0.2671;C8 = 25.3917; C9 = 0.02941;C10 = −373.0887 | |
(22) | V1 = −1.0347;V2 = 8.2429;V3 = 2857.612 | |
(23) | V4 = 3.2224;V5 = 0.1233 | |
(26) | H1 = 0.6013;H2 = 0.0197;H3 = −5.6195 | |
(28) | H4 = 1.0513;H5 = −0.01623;H6 = −706.22 |
Table 4 Parameter estimation results for each equation
方程序号 | 参数估计值 | |
(10) | A1 = 0.045;A2 = −1061.35;A3 = 1229 | |
(12) | A4 = 1.319;A5 = −5.176;A6 = 3152.22 | |
(14) | C1 = 0.1587;C2 = 0.0.3547;C3 = −14.7019; C4 = −0.0999;C5 = 680.6551 | |
(15) | C6 = −0.0873;C7 = 0.2671;C8 = 25.3917; C9 = 0.02941;C10 = −373.0887 | |
(22) | V1 = −1.0347;V2 = 8.2429;V3 = 2857.612 | |
(23) | V4 = 3.2224;V5 = 0.1233 | |
(26) | H1 = 0.6013;H2 = 0.0197;H3 = −5.6195 | |
(28) | H4 = 1.0513;H5 = −0.01623;H6 = −706.22 |
年份 | 真实值/t | 模拟值/t | 相对误差/% | |||
2008 | 116261.34 | 120653.26 | –3.64 | |||
2009 | 134320.52 | 132948.70 | 1.03 | |||
2010 | 134816.54 | 135149.83 | –0.25 | |||
2011 | 129440.86 | 126231.25 | 2.54 | |||
2012 | 76131.14 | 69089.26 | 10.19 | |||
2013 | 123665.63 | 122645.21 | 0.83 | |||
2014 | 101556.86 | 106445.71 | –4.59 |
Table 5 Hydrogen simulation results for ammonia subsystem
年份 | 真实值/t | 模拟值/t | 相对误差/% | |||
2008 | 116261.34 | 120653.26 | –3.64 | |||
2009 | 134320.52 | 132948.70 | 1.03 | |||
2010 | 134816.54 | 135149.83 | –0.25 | |||
2011 | 129440.86 | 126231.25 | 2.54 | |||
2012 | 76131.14 | 69089.26 | 10.19 | |||
2013 | 123665.63 | 122645.21 | 0.83 | |||
2014 | 101556.86 | 106445.71 | –4.59 |
年份 | 真实值/t | 模拟值/t | 相对误差/% | |||
2011 | 64960.63 | 65089.34 | 0.20 | |||
2012 | 60567.31 | 59888.43 | –1.12 | |||
2013 | 59165.66 | 59780.53 | 1.04 | |||
2014 | 56554.02 | 55507.57 | –1.85 | |||
2015 | 53686.56 | 51691.33 | –3.72 | |||
2016 | 49206.54 | 49719.33 | 1.04 | |||
2017 | 50648.84 | 51946.83 | 2.56 | |||
2018 | 50402.01 | 51966.85 | 3.10 | |||
2019 | 52077.10 | 53138.54 | 2.04 | |||
2020 | 52074.54 | 50614.46 | –2.80 |
Table 6 Hydrogen simulation results for crude oil processing subsystem
年份 | 真实值/t | 模拟值/t | 相对误差/% | |||
2011 | 64960.63 | 65089.34 | 0.20 | |||
2012 | 60567.31 | 59888.43 | –1.12 | |||
2013 | 59165.66 | 59780.53 | 1.04 | |||
2014 | 56554.02 | 55507.57 | –1.85 | |||
2015 | 53686.56 | 51691.33 | –3.72 | |||
2016 | 49206.54 | 49719.33 | 1.04 | |||
2017 | 50648.84 | 51946.83 | 2.56 | |||
2018 | 50402.01 | 51966.85 | 3.10 | |||
2019 | 52077.10 | 53138.54 | 2.04 | |||
2020 | 52074.54 | 50614.46 | –2.80 |
年份 | 真实值/108m3 | 模拟值/108m3 | 相对误差/% | |||
2011 | 7.29 | 6.91 | –5.23 | |||
2012 | 8.81 | 8.15 | –7.44 | |||
2013 | 11.21 | 11.42 | 1.88 | |||
2014 | 13.40 | 13.78 | 2.86 | |||
2015 | 15.92 | 15.70 | –1.40 | |||
2016 | 16.19 | 17.14 | 5.88 | |||
2017 | 16.86 | 18.18 | 7.82 | |||
2018 | 20.37 | 20.65 | 1.37 | |||
2019 | 23.51 | 22.51 | –4.26 | |||
2020 | 25.20 | 23.83 | –5.46 |
Table 7 Simulation results of urban natural gas supply
年份 | 真实值/108m3 | 模拟值/108m3 | 相对误差/% | |||
2011 | 7.29 | 6.91 | –5.23 | |||
2012 | 8.81 | 8.15 | –7.44 | |||
2013 | 11.21 | 11.42 | 1.88 | |||
2014 | 13.40 | 13.78 | 2.86 | |||
2015 | 15.92 | 15.70 | –1.40 | |||
2016 | 16.19 | 17.14 | 5.88 | |||
2017 | 16.86 | 18.18 | 7.82 | |||
2018 | 20.37 | 20.65 | 1.37 | |||
2019 | 23.51 | 22.51 | –4.26 | |||
2020 | 25.20 | 23.83 | –5.46 |
年份 | 公交车 | 重卡 | ||||||||||
真实 值/辆 | 模拟 值/辆 | 相对 误差/% | 真实值/ 万辆 | 模拟值/ 万辆 | 相对 误差/% | |||||||
2011 | 4965 | 4766 | –4.00 | 7.40 | 7.38 | –0.28 | ||||||
2012 | 5214 | 5379 | 3.17 | 8.12 | 8.02 | –1.20 | ||||||
2013 | 5359 | 5523 | 3.06 | 8.78 | 8.73 | –0.56 | ||||||
2014 | 5488 | 5649 | 2.93 | 9.56 | 9.14 | –4.41 | ||||||
2015 | 5275 | 5386 | 2.10 | 9.40 | 9.31 | –0.95 | ||||||
2016 | 5233 | 5634 | 7.67 | 9.45 | 9.63 | 1.91 | ||||||
2017 | 5850 | 6161 | 5.32 | 9.78 | 9.97 | 1.96 | ||||||
2018 | 6519 | 6503 | –0.25 | 10.34 | 10.54 | 1.96 | ||||||
2019 | 7314 | 7102 | –2.90 | 10.78 | 11.09 | 2.82 | ||||||
2020 | 7307 | 6815 | –6.73 | 11.66 | 11.28 | –3.23 |
Table 8 Simulation results of the number of buses and heavy trucks
年份 | 公交车 | 重卡 | ||||||||||
真实 值/辆 | 模拟 值/辆 | 相对 误差/% | 真实值/ 万辆 | 模拟值/ 万辆 | 相对 误差/% | |||||||
2011 | 4965 | 4766 | –4.00 | 7.40 | 7.38 | –0.28 | ||||||
2012 | 5214 | 5379 | 3.17 | 8.12 | 8.02 | –1.20 | ||||||
2013 | 5359 | 5523 | 3.06 | 8.78 | 8.73 | –0.56 | ||||||
2014 | 5488 | 5649 | 2.93 | 9.56 | 9.14 | –4.41 | ||||||
2015 | 5275 | 5386 | 2.10 | 9.40 | 9.31 | –0.95 | ||||||
2016 | 5233 | 5634 | 7.67 | 9.45 | 9.63 | 1.91 | ||||||
2017 | 5850 | 6161 | 5.32 | 9.78 | 9.97 | 1.96 | ||||||
2018 | 6519 | 6503 | –0.25 | 10.34 | 10.54 | 1.96 | ||||||
2019 | 7314 | 7102 | –2.90 | 10.78 | 11.09 | 2.82 | ||||||
2020 | 7307 | 6815 | –6.73 | 11.66 | 11.28 | –3.23 |
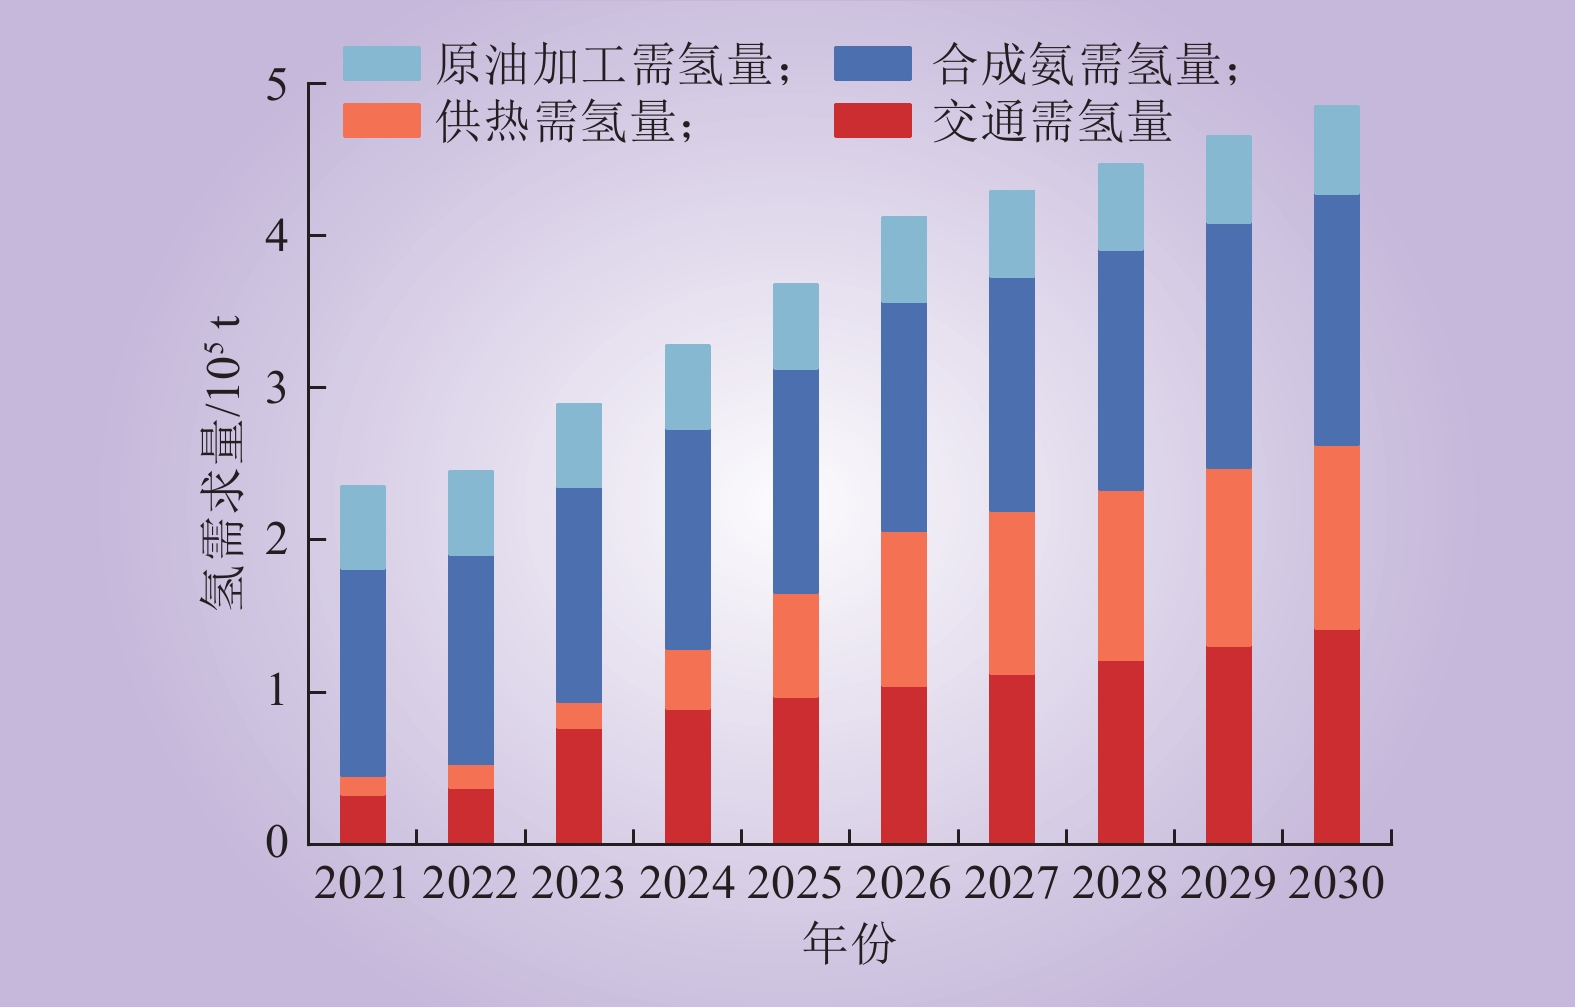
年份 | 合成氨 系统/t | 原油加工 系统/t | 供热 系统/t | 交通 系统/t | 总需氢 量/t | |||||
2021 | 135936.43 | 53639.29 | 12554.15 | 32649.42 | 234779.29 | |||||
2025 | 147731.64 | 54908.92 | 68923.98 | 97411.11 | 368975.65 | |||||
2030 | 165003.69 | 57085.43 | 121284.44 | 141629.52 | 485003.08 |
Table 9 Hydrogen demand projections for 2021, 2025, 2030
年份 | 合成氨 系统/t | 原油加工 系统/t | 供热 系统/t | 交通 系统/t | 总需氢 量/t | |||||
2021 | 135936.43 | 53639.29 | 12554.15 | 32649.42 | 234779.29 | |||||
2025 | 147731.64 | 54908.92 | 68923.98 | 97411.11 | 368975.65 | |||||
2030 | 165003.69 | 57085.43 | 121284.44 | 141629.52 | 485003.08 |
1 | KHATOON S, IBRAHEEM, SINGH A K, et al. Analysis and comparison of various methods available for load forecasting: an overview[C]//2014 Innovative Applications of Computational Intelligence on Power, Energy and Controls with their impact on Humanity (CIPECH). Ghaziabad, India. IEEE, 2015: 243–247. |
2 | 李开卷. 地区电网中长期电力负荷预测研究[D]. 南昌: 南昌大学, 2020. |
LI Kaijuan. Study on medium and long-term electricity load forecasting in regional power grids[D]. Nanchang: Nanchang University, 2020. | |
3 |
廖旎焕, 胡智宏, 马莹莹, 等. 电力系统短期负荷预测方法综述[J]. 电力系统保护与控制, 2011, 39 (1): 147- 152.
DOI |
LIAO Nihuan, HU Zhihong, MA Yingying, et al. Review of the short-term load forecasting methods of electric power system[J]. Power System Protection and Control, 2011, 39 (1): 147- 152.
DOI |
|
4 |
MA T, JI J, CHEN M. Study on the hydrogen demand in China based on system dynamics model[J]. International Journal of Hydrogen Energy, 2010, 35 (7): 3114- 3119.
DOI |
5 |
PARK S Y, KIM J W, LEE D H. Development of a market penetration forecasting model for hydrogen fuel cell vehicles considering infrastructure and cost reduction effects[J]. Energy Policy, 2011, 39 (6): 3307- 3315.
DOI |
6 |
RAHMOUNI S, SETTOU N, NEGROU B, et al. GIS-based method for future prospect of hydrogen demand in the Algerian road transport sector[J]. International Journal of Hydrogen Energy, 2016, 41 (4): 2128- 2143.
DOI |
7 |
张红, 袁铁江, 谭捷. 统一能源系统氢负荷中长期预测[J]. 中国电机工程学报, 2021, 41 (10): 3364- 3372.
DOI |
ZHANG Hong, YUAN Tiejiang, TAN Jie. Medium and long-term forecast of hydrogen load in unified energy system[J]. Proceedings of the CSEE, 2021, 41 (10): 3364- 3372.
DOI |
|
8 | 彭生江, 孙传帅, 妥建军, 等. 面向统一能源系统的中长期氢负荷预测[J]. 中国电力, 2022, 55 (1): 84- 90. |
PENG Shengjiang, SUN Chuanshuai, TUO Jianjun, et al. Medium and long-term hydrogen load forecast for unified energy system[J]. Electric Power, 2022, 55 (1): 84- 90. | |
9 |
HUANG J S, LI W, WU X Y. Forecasting the hydrogen demand in China: a system dynamics approach[J]. Mathematics, 2022, 10 (2): 205.
DOI |
10 | 邓斌, 张楠, 王江, 等. 基于LTC-RNN模型的中长期电力负荷预测方法[J]. 天津大学学报(自然科学与工程技术版), 2022, 55 (10): 1026- 1033. |
DENG Bin, ZHANG Nan, WANG Jiang, et al. Medium- and long-term power load forecasting method based on LTC-RNN model[J]. Journal of Tianjin University(Science and Technology), 2022, 55 (10): 1026- 1033. | |
11 | 王其藩. 系统动力学-修订版[M]. 北京: 清华大学出版社, 2009. |
12 | 李肖冰. 基于系统动力学的中国能源供求预测模型研究[D]. 包头: 内蒙古科技大学, 2015. |
LI Xiaobing. Research on China energy supply and demand forecasting model based on system dynamics[D]. Baotou: Inner Mongolia University of Science and Technology, 2015. | |
13 | 陈智锴. 基于系统动力学的工业园区电力需求分析与预测[D]. 北京: 北京交通大学, 2019. |
CHEN Zhikai. Analysis and forecast of power demand in industrial parks based on system dynamics[D]. Beijing: Beijing Jiaotong University, 2019. | |
14 | 刘亚琼. 基于系统动力学的广东省电力需求预测模型的研究[D]. 广州: 华南理工大学, 2016. |
LIU Yaqiong. Research on Guangdong power demand forecasting model based on system dynamics[D]. Guangzhou: South China University of Technology, 2016. | |
15 | 陈蓉珺, 何永秀, 陈奋开, 等. 基于系统动力学和蒙特卡洛模拟的电动汽车日负荷远期预测[J]. 中国电力, 2018, 51 (9): 126- 134. |
CHEN Rongjun, HE Yongxiu, CHEN Fenkai, et al. Long-term daily load forecast of electric vehicle based on system dynamics and Monte Carlo simulation[J]. Electric Power, 2018, 51 (9): 126- 134. | |
16 |
LOPEZ-ARBOLEDA E, SARMIENTO A T, CARDENAS L M. Policy assessment for electromobility promotion in Colombia: a system dynamics approach[J]. Transportation Research Part D:Transport and Environment, 2023, 121, 103799.
DOI |
17 | 熊亚林, 刘玮, 高鹏博, 等. “双碳”目标下氢能在我国合成氨行业的需求与减碳路径[J]. 储能科学与技术, 2022, 11 (12): 4048- 4058. |
XIONG Yalin, LIU Wei, GAO Pengbo, et al. Demand of hydrogen energy in China’s synthetic ammonia industry and carbon reduction path under the goal of “double carbon”[J]. Energy Storage Science and Technology, 2022, 11 (12): 4048- 4058. | |
18 |
SHARIFZADEH M, SIKINIOTI-LOCK A, SHAH N. Machine-learning methods for integrated renewable power generation: a comparative study of artificial neural networks, support vector regression and Gaussian process regression[J]. Renewable and Sustainable Energy Reviews, 2019, 108, 513- 538.
DOI |
19 |
贾亮. 我国合成氨及下游产品工业消费现状与预测[J]. 化学工业, 2012, 30 (S1): 38- 41.
DOI |
JIA Liang. Consumption situation and prediction of ammonia and its downstream industries in China[J]. Chemical Industry, 2012, 30 (S1): 38- 41.
DOI |
|
20 |
张卫峰, 季玥秀, 马骥, 等. 中国化肥消费需求影响因素及走势分析: Ⅰ化肥供应[J]. 资源科学, 2007, 29 (6): 162- 169.
DOI |
ZHANG Weifeng, JI Yuexiu, MA Ji, et al. Factors affecting fertilizer demand and supply in China[J]. Resources Science, 2007, 29 (6): 162- 169.
DOI |
|
21 |
王建建, 胡辰树. 我国氢燃料电池专用车发展现状与趋势分析[J]. 专用汽车, 2021, (4): 51- 55.
DOI |
WANG Jianjian, HU Chenshu. Development status and trend analysis of special purpose vehicle for hydrogen fuel cell in China[J]. Special Purpose Vehicle, 2021, (4): 51- 55.
DOI |
|
22 | 周静. 天然气管线掺混氢气的特性分析[D]. 抚顺: 辽宁石油化工大学, 2020. |
ZHOU Jing. Characteristic analysis of natural gas pipeline mixed with hydrogen[D]. Fushun: Liaoning Shihua University, 2020. | |
23 | 白雪松. 国内外氢气的生产和消费[J]. 化工技术经济, 2003, 21 (12): 18- 25. |
BAI Xuesong. An analysis on the production and consumption of hydrogen in the world and China[J]. Chemical Techno-Economics, 2003, 21 (12): 18- 25. | |
24 | 张烘玮, 赵杰, 李敬法, 等. 天然气掺氢输送环境下的腐蚀与氢脆研究进展[J]. 天然气工业, 2023, 43 (6): 126- 138. |
ZHANG Hongwei, ZHAO Jie, LI Jingfa, et al. Research progress on corrosion and hydrogen embrittlement in hydrogen-natural gas pipeline transportation[J]. Natural Gas Industry, 2023, 43 (6): 126- 138. | |
25 |
WITKOWSKI A, RUSIN A, MAJKUT M, et al. Analysis of compression and transport of the methane/hydrogen mixture in existing natural gas pipelines[J]. International Journal of Pressure Vessels and Piping, 2018, 166, 24- 34.
DOI |
26 | 彭生江, 杨德州, 孙传帅, 等. 基于氢负荷需求的氢能系统容量规划[J]. 中国电力, 2023, 56 (7): 13- 20, 32. |
PENG Shengjiang, YANG Dezhou, SUN Chuanshuai, et al. Capacity planning of hydrogen production and storage system based on hydrogen load demand[J]. Electric Power, 2023, 56 (7): 13- 20, 32. | |
27 | 尚娟, 鲁仰辉, 郑津洋, 等. 掺氢天然气管道输送研究进展和挑战[J]. 化工进展, 2021, 40 (10): 5499- 5505. |
SHANG Juan, LU Yanghui, ZHENG Jinyang, et al. Research status-in-situ and key challenges in pipeline transportation of hydrogen-natural gas mixtures[J]. Chemical Industry and Engineering Progress, 2021, 40 (10): 5499- 5505. | |
28 | 卢子敬, 李子寿, 郭相国, 等. 基于多目标人工蜂鸟算法的电-氢混合储能系统最优配置[J]. 中国电力, 2023, 56 (7): 33- 42. |
LU Zijing, LI Zishou, GUO Xiangguo, et al. Optimal configuration of electricity-hydrogen hybrid energy storage system based on multi-objective artificial hummingbird algorithm[J]. Electric Power, 2023, 56 (7): 33- 42. | |
29 | 魏震波, 魏平桉, 郭毅, 等. 考虑需求侧管理和碳交易的电-气互联网络分散式低碳经济调度[J]. 高电压技术, 2021, 47 (1): 33- 44. |
WEI Zhenbo, WEI Pingan, GUO Yi, et al. Decentralized low-carbon economic dispatch of electricity-gas network in consideration of demand-side management and carbon trading[J]. High Voltage Engineering, 2021, 47 (1): 33- 44. |
[1] | Rui ZHU, Qihe LOU, Xiaoling JIN, Chang LIU. Evolution of Functional Investment Structure of Power Grid Infrastructure Suitable for New Power System [J]. Electric Power, 2024, 57(9): 194-204. |
[2] | Zhuan ZHOU, Shuai MIAO, Tiejiang YUAN. System Dynamics Modeling of Green Hydrogen Steel Smelting to Improve Wind Power Consumption [J]. Electric Power, 2024, 57(8): 36-45. |
[3] | ZHANG Jinliang, ZHOU Xiuxiu. Impact Analysis of Market-Driented Carbon Emission Reduction Policies in Power Generation Industry Based on System Dynamics [J]. Electric Power, 2020, 53(6): 114-123. |
[4] | DU Zhendong, XU Erfeng, ZHANG Xiaodi, LIU Dunnan, SHEN Shuyi. Research on Evolution and Development of Power Generation Scale and Cost under Tradable Green Certificates Market in China [J]. Electric Power, 2019, 52(7): 168-176. |
[5] | CHEN Rongjun, HE Yongxiu, CHEN Fenkai, DONG Mingyu, LI Dezhi, GUANG Fengtao. Long-term Daily Load Forecast of Electric Vehicle Based on System Dynamics and Monte Carlo Simulation [J]. Electric Power, 2018, 51(9): 126-134. |
[6] | MA Xiaomin, GAO Jian, WU Chi, HE Rui, GONG Yiyu, LI Yi, WU Tianbao. Prediction Model for Icing Thickness of Power Transmission Line Based on Grey Support Vector Machine [J]. Electric Power, 2016, 49(11): 46-50. |
[7] | ZHENG Ya-nan, SHAN Bao-guo, GU Yu-gui, LIU Wei, LI Geng-yin. Study on Methods of Structure Improvement for Power Load Grey Forecasting [J]. Electric Power, 2013, 46(6): 108-112. |
[8] | ZHANG Wei, DENG Yuan-chang. Short-Term Wind Speed and Wind Power Prediction Based on the Grey-Markov Chain [J]. Electric Power, 2013, 46(2): 98-102. |
[9] | ZHENG Ya-nan, SHAN Bao-guo, GU Yu-gui, LI Geng-yin. Data Preprocessing for Grey Model of Medium-Long Term Load Forecasting [J]. Electric Power, 2013, 46(10): 111-114. |
Viewed | ||||||
Full text |
|
|||||
Abstract |
|
|||||